
 EN
EN



Introduction: from complaint to component
Every plant has a complaint that never quite goes away. A line that "always backs up at the labeller", a station that "cannot keep pace", a shift that "never hits the target". Turning that complaint into a funded project requires one skill above all others: the ability to map a production bottleneck to specific automation components. Do that well, and process improvement stops being a matter of opinion and becomes a matter of measurement.
This article offers a practical method that maintenance engineers, production managers, and system integrators can use to move from symptom to solution. The goal is not to buy hardware quickly; it is to attach the right automation components to the right constraint, so that process improvement delivers measurable throughput rather than a new set of worries.
What a production bottleneck actually is
A production bottleneck is the single step that limits the output of an entire line. It is not necessarily the slowest machine, nor the most expensive one; it is the one whose capacity caps everything downstream. Identifying a production bottleneck correctly is the first and most important act of process improvement, because effort spent anywhere else is largely wasted.
Two traps are common. The first is mistaking a symptom for a cause: a queue forming in front of a station may point to the station upstream, not the station itself. The second is treating a temporary production bottleneck, such as a changeover or a tooling change, as a permanent one. Neither trap survives a disciplined mapping exercise that links each observed bottleneck to specific automation components.
A six-step method to map a production bottleneck
The following method converts observation into a component list. Each step narrows the gap between a production bottleneck and the automation components that can relieve it.
Step 1: Observe the line at full demand
Watch the line during peak demand, not during a quiet shift. A production bottleneck that disappears at low volume is a scheduling issue, not a capacity one. Note where work-in-progress accumulates and where operators wait.
Step 2: Measure cycle time at every station
Record cycle time for each station and compare it with takt time. The station whose cycle time exceeds takt is the production bottleneck. Simple stopwatch data, gathered over several hours, is usually enough to begin.
Step 3: Categorise the constraint
Classify the production bottleneck as speed, changeover, quality, reliability, or manual handling. This categorisation determines which automation components can realistically help, and it prevents a process improvement plan from reaching for the wrong technology.
Step 4: Match each category to automation components
Every constraint category maps to a familiar family of automation components:
| Constraint | Typical automation components |
|---|---|
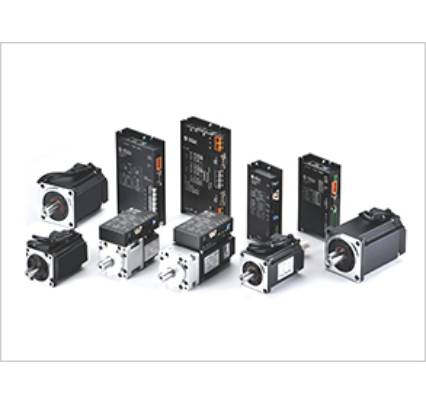
| Speed | Servo drives, servo motors, high-speed I/O |
| Changeover | Servo axes, recipe-driven HMI, quick-change tooling |
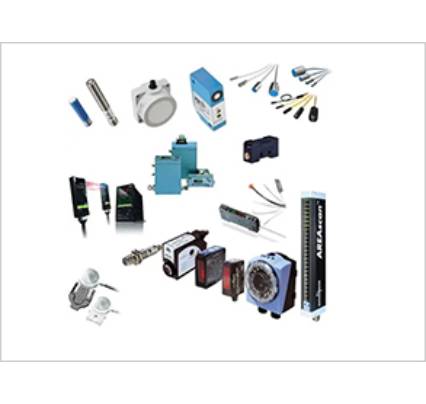
| Quality | Vision sensors, sensing devices, closed-loop control |
| Reliability | Redundant PLC, diagnostics, robust control hardware |
| Manual handling | Pneumatic components, actuators, robotic units |
Step 5: Quantify the process improvement
Estimate the gain each option offers: seconds saved per cycle, scrap reduced, or changeover minutes removed. A process improvement without a number cannot be prioritised, and priorities are what justify spending.
Step 6: Cost the automation components against the gain
Compare the payback of each option. When two sets of automation components deliver a similar gain, choose the set that is easier to maintain and to source spare parts for — maintainability is a form of process improvement that keeps paying out.
Common production bottleneck patterns and their remedies
Across industries, the same patterns recur. Recognising them speeds up the mapping.
| Pattern | Likely production bottleneck | Candidate automation components |
|---|---|---|
| Starved downstream station | Upstream feeder | Servo drive, indexing conveyor, sensing |
| Changeover queue | Manual setup | Servo axes, recipe HMI, tooling |
| Reject accumulation | Inspection | Vision sensor, closed-loop control |
| Operator idle time | Manual transfer | Pneumatic components, actuator, robot |
| Micro-stops | Control reliability | Diagnostics, redundant PLC, quality components |
A team that has seen these patterns before can usually locate the true production bottleneck in a single walk of the line. That is the essence of fast, evidence-based process improvement.
Where possible, pull the evidence from the machine itself rather than from memory. Modern drives and controllers log cycle counts, run hours, and fault codes, and those records are often more reliable than a handwritten tally. Use them to confirm what the stopwatch suggested, and reconcile any difference before committing to a change.
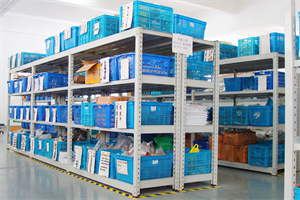
Caption: Official website asset — representative factory environment imagery, not tied to a specific project.
Turning the map into a process improvement plan
Once the production bottleneck and its candidate automation components are documented, the map becomes a plan:
- Rank every option by gain per unit of cost.
- Group automation components that share a platform to simplify support.
- Sequence the work so each stage delivers value on its own.
- Define how the process improvement will be measured after start-up.
- Set a review date to confirm the original production bottleneck has actually moved.
A plan built this way keeps the focus on flow, not on shopping lists. The automation components are chosen because they relieve a specific constraint, and the process improvement is verified against numbers rather than impressions.
Measuring process improvement after start-up
A map is only validated by results, so every project needs a simple measurement routine. Define the baseline before any change, then repeat the same measurement after start-up, using the same method and the same shift pattern. Consistency matters more than sophistication; a rough number measured the same way twice is worth more than a precise number measured inconsistently. Without a baseline, any later claim of process improvement is impossible to defend.
Define the baseline
Record the current output, scrap rate, changeover time, and downtime for the affected station. Keep the record simple and store it where the production team can see it. A baseline that nobody can find is a baseline that will be disputed later.
Choose the right review window
Measure over a period that reflects normal demand, and avoid reading too much into the first shift after start-up. Give the team time to adjust to the new workflow before drawing conclusions.
Compare against the target
Place the post-change figures next to the baseline and the target. If the gap is smaller, the plan worked; if not, revisit the constraint category rather than adding more hardware blindly. The purpose of measurement is to guide the next decision, not to assign blame.
Watch for the constraint moving
Relieving one constraint almost always reveals another. Treat the movement of the constraint as a sign of success, and feed it straight back into the next round of analysis. Over time, this loop becomes the plant's normal way of working.
Document what you learned
Write down which interventions worked and which did not. A short record of each change, its cost, and its result builds an internal knowledge base that accelerates every future decision. New engineers can read it, and repeatable gains compound.
Keep the team involved
Finally, share results with the people who run the line. Operators notice changes long before the reports do, and their observations often explain an unexpected number. Involving them turns measurement from an audit into a shared habit.
A disciplined routine of this kind turns a single project into a continuous capability. The numbers stay honest, the team stays engaged, and each round of work builds on the last rather than starting from scratch. That is what makes process improvement sustainable rather than a one-off event, and it is the habit that separates plants which keep getting faster from those that stall after a single win.
Illustrative scenario — replace with verified customer data before publication
In September 2024, at a metal-parts plant in Penang, Malaysia, a recurring production bottleneck formed ahead of a manual deburring station. The team measured cycle times, confirmed the station exceeded takt time by eleven seconds, and categorised the constraint as manual handling. They selected pneumatic components and a compact actuator set, together with sensing to confirm part presence. A short process improvement programme reduced the queue and lifted line output without adding a second operator. The production bottleneck then shifted to a downstream packing step, which became the focus of the next review.
This scenario is illustrative and is intended to demonstrate the method, not to describe a verified customer. Replace it with documented project data before publication.
Sourcing automation components for the mapped plan
Mapping a production bottleneck is only useful if the chosen automation components can be sourced reliably and supported over time. For cross-border buyers, a partner that offers product selection, control circuit design, PLC programming, system assembly, installation guidance, and troubleshooting support can turn a component map into a working system. Explore the AI Omni Control product range to see how PLCs, HMIs, frequency inverters, servo motors, servo drives, sensors, low-voltage products, and pneumatic components map onto the constraint categories above.
Because a single supplier can often cover several categories, the process improvement plan becomes easier to execute and to maintain. Visit the AI Omni Control main site to understand the engineering support available alongside the hardware.
Quality Assurance & Certifications
Certification requirements for the automation components in any process improvement project should be confirmed for the exact product and application before ordering. Depending on the destination market and the equipment selected, buyers may expect documentation such as ISO 9001 quality management, CE marking for the European Economic Area, UL, or equivalent national approvals. Because these requirements vary by product family and country, always request the specific certificates that apply to your chosen automation components, and confirm them within the final quotation for your process improvement project.
Conclusion: measure, map, then buy
A production bottleneck does not need to be guessed at, and process improvement does not need to be a leap of faith. Observe the line at full demand, measure each station, categorise the constraint, and match it to automation components with a known payback. Do this repeatedly, and the plant develops a habit of evidence-based process improvement. Every production bottleneck you clear moves the constraint somewhere new — which is exactly why mapping, not shopping, is the durable skill.
Table of Contents
- Introduction: from complaint to component
- What a production bottleneck actually is
- A six-step method to map a production bottleneck
- Common production bottleneck patterns and their remedies
- Turning the map into a process improvement plan
- Measuring process improvement after start-up
- Illustrative scenario — replace with verified customer data before publication
- Sourcing automation components for the mapped plan
- Quality Assurance & Certifications
- Conclusion: measure, map, then buy